About K.States
K.States is a web application for visualizing state lattices of knots. You can input a knot diagram in PD notation and select a fixed segment to generate the associated Kauffman state lattice.
For the explanation of the PD notation, please refer to
KnotInfo's PD notation description.
We slightly change the syntax instead of brackets or letters between crossings,
we seperate the segments of a crossing with a comma and the crossings with a
semicolon.
For example the PD notation for the knot 8_8 from the Rolfsen table is:
1,7,2,6; 2,5,3,6; 5,12,4,11; 4,10,3,11; 1,8,16,7; 16,13,15,12; 13,8,14,9; 14,10,15,9
The PD notation is not unique, so there are many different ways to write the same knot. So the above notation is only one of many possible PD notations for the knot 8_8.The site returns a visualization of the lattice as well as further data about the knot, such as:
- Number of Kauffman states
- F-Polynomial
- Alexander Polynomial
- Marker positions for the minimal and maximal state
- Sequence of transpositions from min to max state
Images of the lattice are generated for knots with up to 12 crossings; polynomial and lattice data is generated for knots up to 20 crossings.
The source code for the lattice generation is available on GitHub.
What are K.States?
K.States is short for Kauffman States which is a concept from knot theory introduced by Louis Kauffman in the 1980s. Given a knot diagram, we assign a marker - a dot in one of the four regions around each crossing - to each of the crossings in the diagram. We call this assignment a Kauffman state if no two markers are in the same region in the diagram. In the following image you can see an example of a Kauffman state.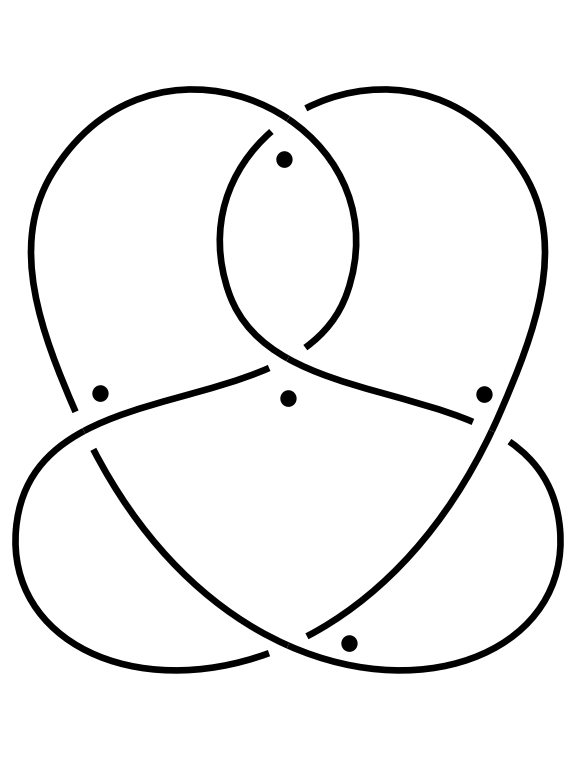 If we have a Kauffman state, we can create a new state by an
operation called state transposition.
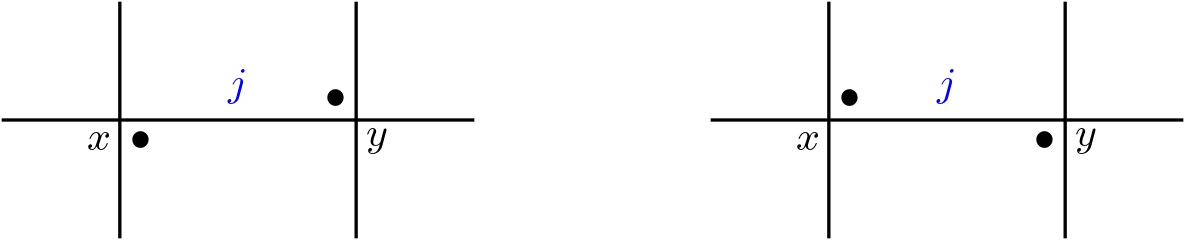
For this operation we look for a segment between two crossings which has
markers on both ends in the regions above and below the segment.
In this case we can swap the markers on the two crossing and create a new state.
If we have a Kauffman state, we can create a new state by an
operation called state transposition.
For this operation we look for a segment between two crossings which has
markers on both ends in the regions above and below the segment.
In this case we can swap the markers on the two crossing and create a new state.
For any questions or suggestions, feel free to reach out via mail at kstates810@gmail.com.
This project was created by Timo Hauser.